TRON is a revolutionary product needed for an initiative towards the need for transition to Web 3.0 technologies. With the cryptocurrency, smart contracts, and dApps supporting the ecosystem, anyone can create their own dApp on the TRON blockchain and accept digital compensation for the services or content.
Since the offered services allow anyone to privately share their content without losing authority over them makes this blockchain a necessary tool to move towards Web 3. The market capitalization of TRX above $5 billion has helped it remain in the top 15 cryptocurrencies.
TRON has retracted back to the 50 EMA curve after getting support from its previous low support of $0.0583. The uptrend potential for this cryptocurrency could be possible to sustain for the short term if TRX could breach the 100 EMA curve without generating a red candle.
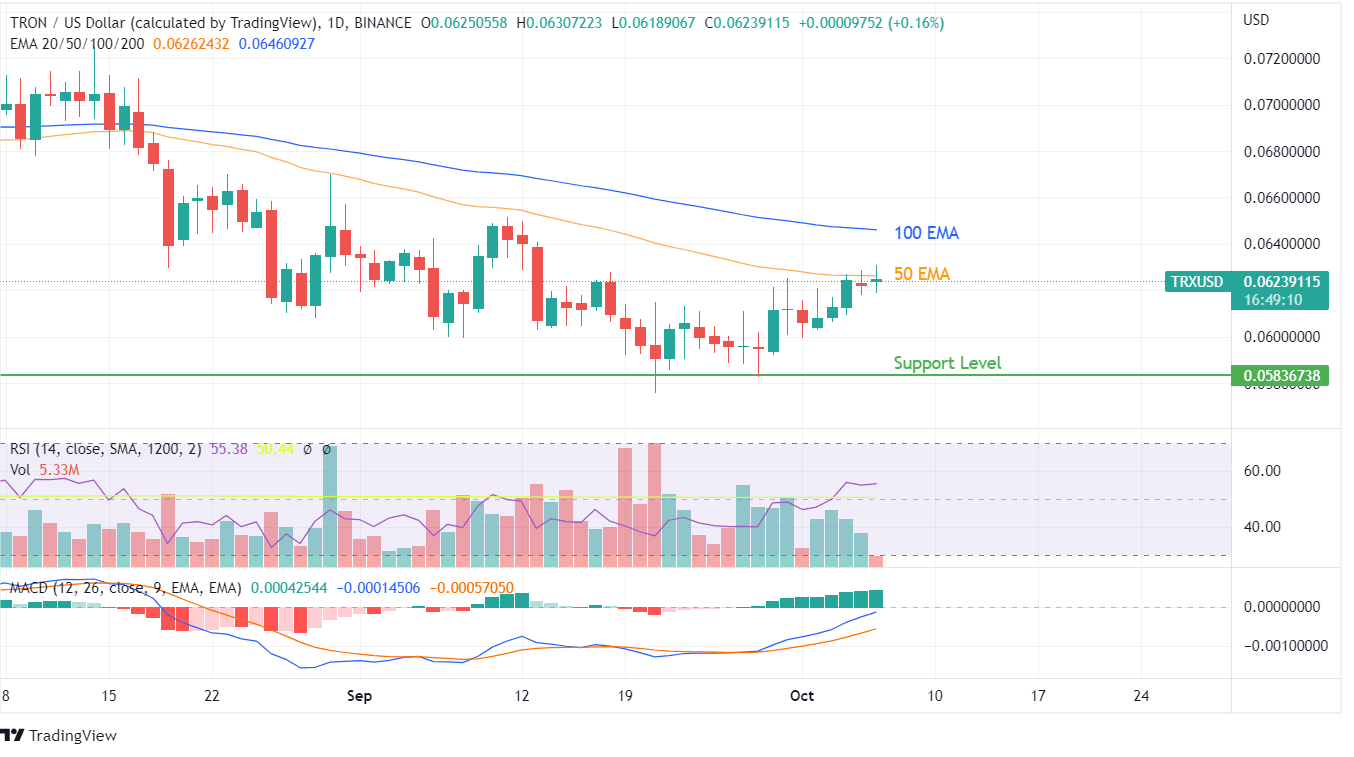
TRX price action has been rather positive compared to other cryptocurrencies, which have been far more volatile. Since TRON holders are on smaller losses, we haven’t yet witnessed any significant sell-offs.
September has been a rather un-trending momentum, but October showcases the potential to test resistance levels and take TRX beyond the consolidation zone of the last few months. In terms of technical indicators, RSI has been more vocal about the increasing buying volumes seen in the previous week that took the bearings of RSI from the lows of 36 to the peaks of 55.
Since September 26, 2022, the MACD indicator has also marked a bullish crossover, and in the resulting days of trading, TRX jumped decently. The consolidation of TRON cryptocurrency is expected as the moving averages will arrest the other trendline value for a short while before an aggressive buying action is capable of breaching the restraint.
The second weekly candle of September 2022 formed to deviate from the bullish sentiment is yet to be engulfed by the bullish candle of October as prices need to jump to reach a status quo. Based on the current price action, both the RSI and MACD indicators can create bullish indications in the coming weeks. Till then, the price action can be expected to move slowly.